Is Britain really drowning in booze?
Everybody knows that drinking in the UK is out of control, driven by a combination of feckless consumers and complacent supermarkets offering cheap deals. But is everybody right?
Here’s Don Foster, Lib Dem shadow Culture, Media and Sport Secretary. “The easy availability of cheap alcohol is encouraging ever great numbers of people to drink unsafe amounts” he said last week. “There’s a danger that the country is in the grips of a hidden middle class drinking epidemic.”
Or take Andrew Lansley, the Conservative shadow Health Secretary. “Labour’s irresponsible decision to roll out 24-hour drinking in our towns and communities while at the same time failing to deal with the problems caused by over-drinking has caused great harm, particularly amongst younger people.”
Both men were responding to figures from the ONS that show that those dying from alcohol-related disease are rising, which is undeniable. Even allowing for changes in 2001 which increased the number of diseases reckoned to be caused by drink, the trend is upwards. That’s bad news, but is it right to attribute the rise to recent increases in drinking, or to changes in the licensing laws?
The Conservative press release helpfully refers us to a report published last year by the Joseph Rowntree Foundation, Drinking in the UK: an exploration of the trends. This reports data already available from ONS which shows that (Northern Ireland excepted) there has actually been a decline in weekly drinking by men and women in recent years.
Binge drinking levels (twice the recommended daily limit) have changed little between 1998 and 2006, the report says. There has been an increase among women, and a fall amongst men aged 16-24.
“There is some evidence” it says, “that the proportion of drinkers under 16 has fallen slightly since 1988 in England, Northern Ireland and Scotland, though this is not consistent across boys and girls of different ages. Among those who do drink, average units consumed increased markedly between 1990 and 2006, with a larger increase among 1—to 13 year-old boys. This may have recently decreased in England in 2007.”
ONS provides data on weekly alcohol consumption, and the percentage of men and women who exceed specified amounts. These do not, in general, support the notion of a booze-sodden nation staggering from one drink to the next. The tables summarise the data.
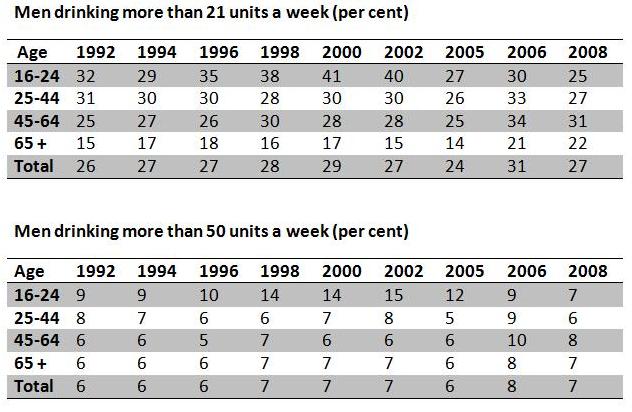
The striking thing about these tables is how relatively little change they show over 16 years, with the exception of a sharp increase between 2005 and 2006. This is an artefact caused by a revised methodology for converting volumes of alcohol to units, assuming an average wine glass size.
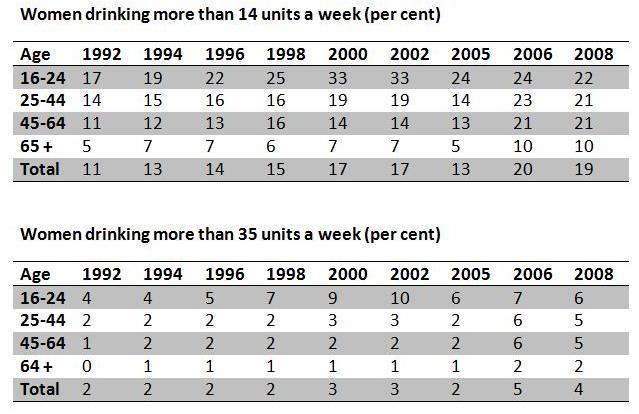
The effect of the change is huge. For example, the proportion of men drinking more than 21 units a week in 2006 was 23 per cent (old methodology) or 31 per cent (new). Among women, the proportion drinking more than 14 units was 12 per cent (old) and 20 per cent (new). No doubt the new methodology gives a better measure of actual consumption, but what we are interested in is the trend, which is heavily obscured by the change.
All the apparent recent increase in drinking derives from this change – otherwise one would have to believe, say, that the number of women aged 45-64 drinking more than 35 units a week had tripled in a single year. The tables have other discontinuities, such as the change from financial year to calendar year in 2004, and from unweighted data to weighted data in 1998. But they are the best we have.
The data for binge drinking show a similar lack of trend. In 1998, 39 per cent of men admitted drinking more than four units “on at least one day last week” – in 2008 the figure was 37 per cent, despite the changed methodology which produced a surge in 2006. For men drinking more than eight units on at least one day, the figure was 22 per cent in 1998, 21 per cent in 2008. Among 16-24 years olds, it had declined from 39 per cent to 30 per cent.
Among women, the trend is up but is accounted for entirely by the abrupt increase in 2006 when the new methodology came in. Since women tend to drink wine, they appear to have been more affected by the change than men. Without the change, the “soaring” increase in drinking by women disappears.
So what about alcohol-related deaths? According to the ONS, these have doubled since the early 1990s, from 6.7 per 100,000 in 1992 to 13.6 per 100,000 in 2008. By far the greatest number of deaths are amongst those aged 55 to 74, since the effects of excessive drinking are long-term. The trend shows signs of flattening off in women, a trend less marked in men. The graph below conmes from the ONS statistical bulletin that originally provoked the comments from the LibDems and the Conservatives.
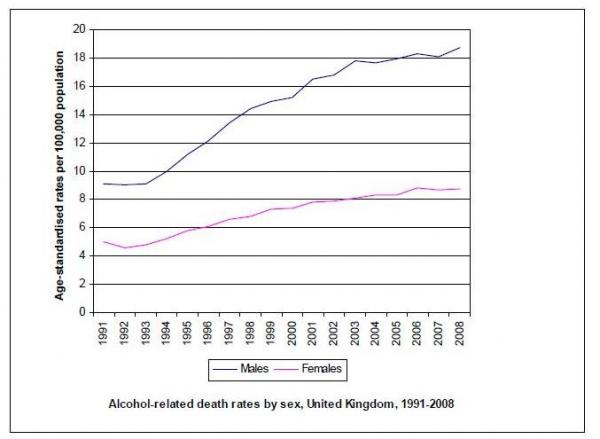
This increase is real, but cannot be blamed on any recent changes in drinking habits or on changes in the licensing laws. The rise in men was apparent by the early 1990s and must have been largely caused by drinking in earlier years. Alternatively, it is possible that some of the increase could be due to the decline in other causes of death, particularly heart disease. Men are surviving for long enough for their drinking to catch up with them.
There are clearly no grounds for complacency. But equally, there seems to be little justification for the sweeping generalisations about drinking habits, and their effects, if the trends are analysed carefully.

Anonymous (not verified) wrote,
Fri, 19/03/2010 - 11:04
And let's not forget the actual numbers: 9,031 alcohol related deaths in 2008.
At less than two percent of total mortality I think it's entirely possible, even likely, that any increase is a result of improvements elsewhere.
RK